Make working with JSON easy
JSON Crack eliminates the chaos of raw, messy data, making the complex appear simple and easy to understand.
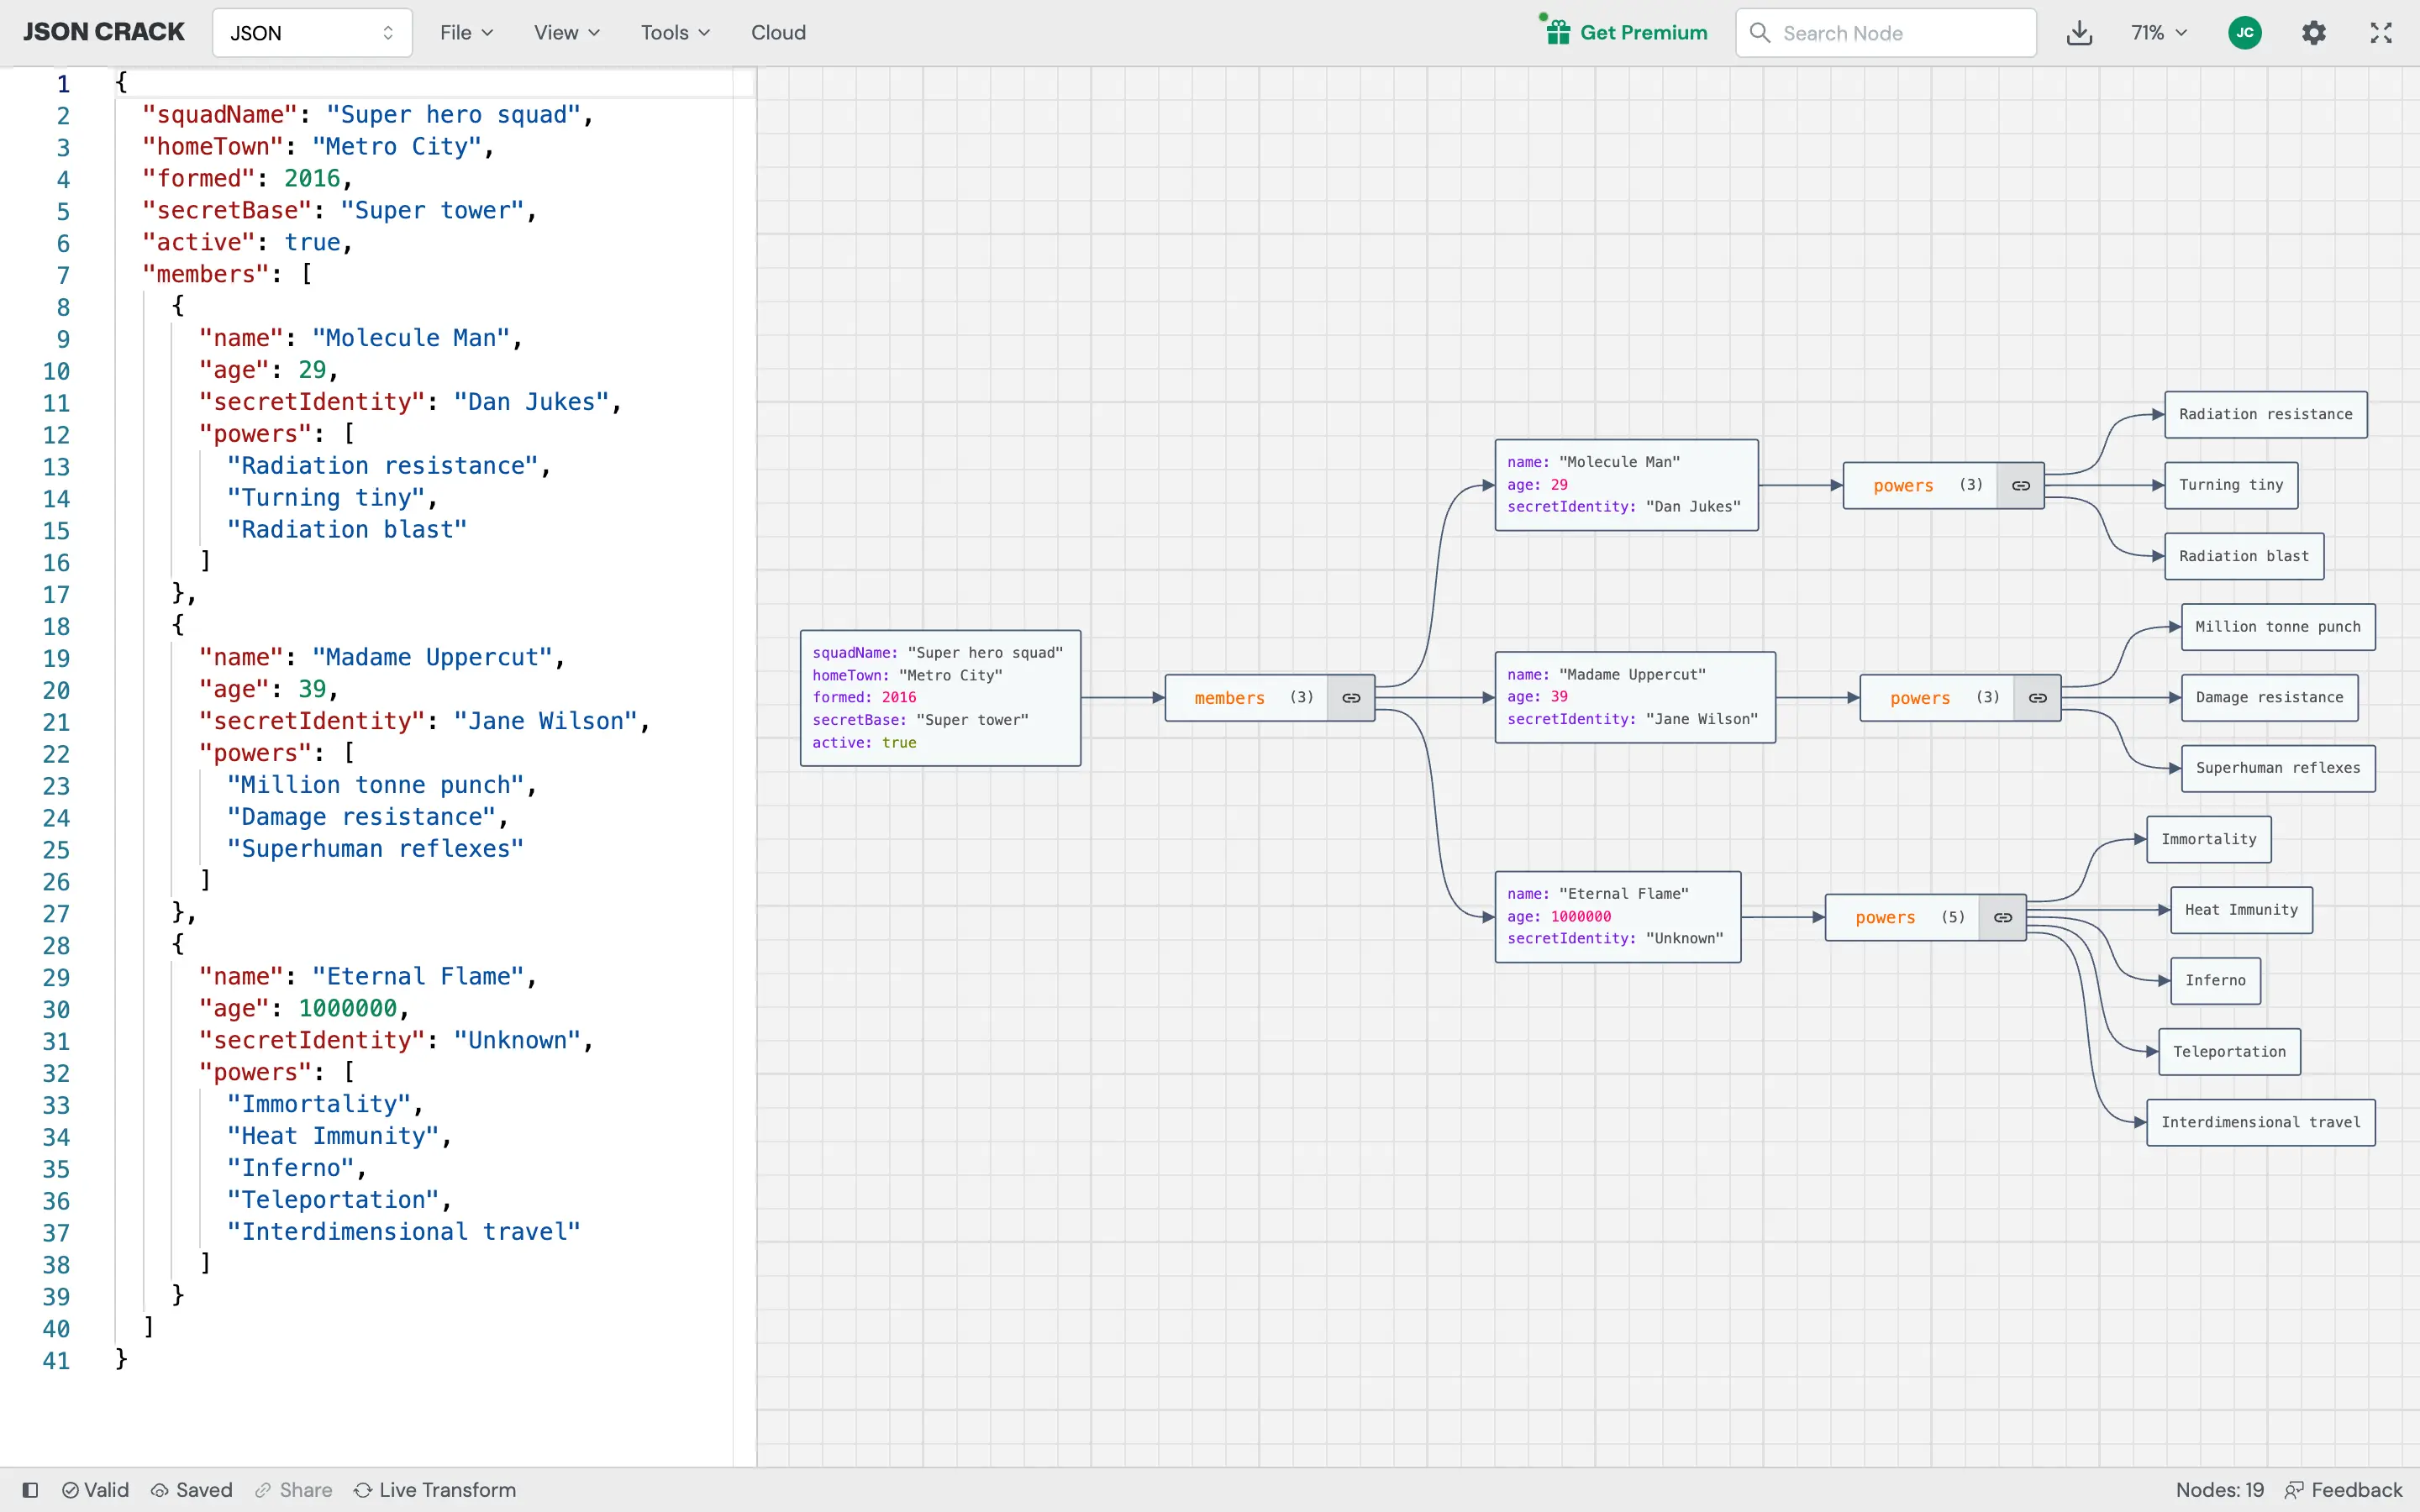
Upload your data
Upload your JSON file, URL, or type your data directly into our easy-to-use text editor.
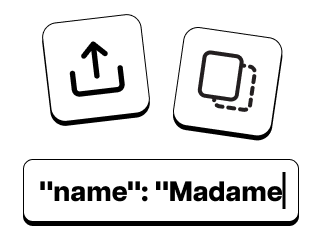
Visualize your JSON
Your data will automatically be turned into a visual tree graph so you can quickly understand your data at a glance.
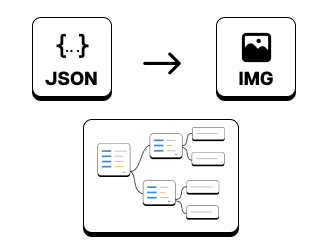
Export to image
Once you're satisfied, you can export an image of your graph as PNG, JPEG, or SVG and share with others.
Don't waste time with JSON formatters
Format JSON and transform into a readable graph in seconds. JSON Crack is an open-source online tool that helps you visualize and understand data.

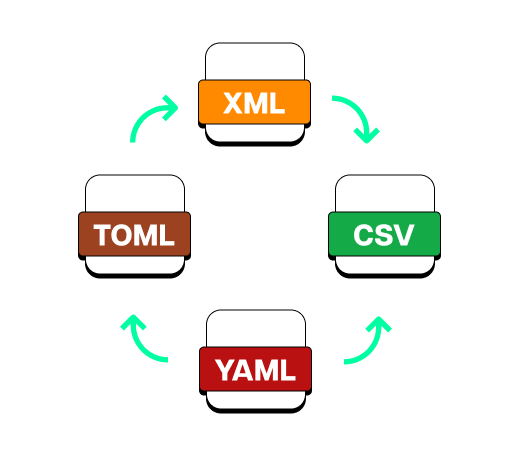
Visualize and convert to multiple formats
JSON Crack supports formats like CSV, YAML, and XML, making it easier to visualize your data, no matter the type.
Explore Your Data Visually
All in one tool for JSON, YAML, CSV, and XML.
JSON Visualizer
Transform your data into interactive graphs or trees as you type. Supports JSON, YAML, CSV, and XML.
Convert Data
Convert JSON to CSV, YAML to JSON, XML to JSON, and more. Our JSON converter supports multiple formats for easy data exchange.
JSON Formatter and JSON Validator
Format and beautify your JSON data to make it more readable. Validate JSON, YAML, and CSV.
Generate Code/Types
Generate TypeScript interface, Golang structs, Rust serde, JSON Schema and more.
JSON Schema Generator
Validate JSON Schema, create mock data, and generate JSON Schema from various data formats like JSON, YAML, XML, and CSV.
Advanced JSON Tools
Decode JWT, randomize data, execute jq (JSON Query), json path commands.
Export Image
Export image of the graphs as PNG, JPEG, or SVG. Share your data visualization with others.
Secure
Your data is never stored on our servers. Everything happens on your device.